Frameworks, data and recommendations on how to explore ACV trends for your business in a methodical, research-driven manner, and extract actionable insights you can use for pricing and go-to-market strategy
Oct. 26, 2022
Author: Bryan Belanger
Oct. 26, 2022
Author: Bryan Belanger

We’ve received a lot of questions and seen a lot of recent social media activity around high annual contract value (ACV) deals in SaaS. ACV examples and benchmarks are in demand, we hypothesize, due to the SaaS industry’s growing embrace of product-led growth (PLG) motions. PLG motions advocate that monetization occurs after the customer’s usage of the product increases their value. Each customer is monetized gradually over time as their usage and value grow.
This creates the perception that PLG companies by default generate lower ACVs than sales-led companies, since price points start at $0 and grow incrementally through increased usage. This perception isn’t necessarily reality, and product-led and sales-led motions are not mutually exclusive, but it’s prompting decision makers across the industry to take a deeper look at ACV trends for their direct and aspirational peers.
So that’s what we’re doing in today’s post. We’re deep diving on ACV trends in SaaS pricing and providing some frameworks, data and recommendations on how to explore ACV trends for your business in a methodical, research-driven manner, and extract actionable insights you can use for pricing and go-to-market (GTM) strategy.
A really important, but often overlooked, step is to ensure that you define what you’re seeking to investigate about competitor and/or SaaS industry ACV trends and, most importantly, why you’re looking for that information. This establishes a context for how you’ll make decisions based on the information and insights you gather.
Again, a lot of the discussions and questions we’ve seen of late are about high ACV, so that’s where we are focusing.
It’s important to first define exactly what “high ACV” means. There are many ways of looking at annual contract value as a metric. ACV can be measured for an individual customer, a specific cohort of customers and/or for a business overall. ACV can be computed as an overall average, with minimum, maximum and average ranges, and/or with percentiles. ACV can be measured at a point in time or over a period of time. You need to get specific on exactly what you’re measuring and how.
ACV is also related to, but different from, many other similar SaaS metrics, such as average revenue per user (ARPU) and average revenue per account (ARPA). This blog from Klipfolio provides a solid high-level breakdown of the differences between ACV and ARPA, for example. ACV can be defined and measured differently, and there are fewer industry standards than other metrics. So you need to get really clear on exactly what metric(s) you are calculating.
You also need to define what high ACV versus low ACV means for your business and for the question(s) you’re trying to answer. Is it purely a dollar value that determines what is high ACV versus average or low ACV, or is there another dividing line? For example, perhaps you consider all self-service customers as low or average ACV, and all sales-supported customers as high ACV. The important part is defining those criteria clearly for your business and category; you can’t manage what you can’t clearly and consistently measure.
Once you’ve landed on a definitional framework, you can start to attack your key research question(s). Based on the interactions we’ve had on this topic, there are two major categories of questions associated with high-ACV SaaS, which we outline below. Each of these primary questions has a series of related subquestions and topics to explore.
These are interrelated and important, but different, questions, and they help with different business needs. Answers to the first question can help you understand typical customer profiles and consumption behaviors. Answers to the second question can help you understand tactically how you might approach positioning, pricing and go-to-market execution for your target ACV customers.
Let’s illustrate the differences in these questions with an example from PLG and overall SaaS industry darling HubSpot.
HubSpot Marketing Hub is offered in three paid editions: Starter, Professional and Enterprise. In addition, HubSpot offers a free plan. HubSpot pricing is based on a monthly subscription fee that scales based on the number of marketing contacts. Each plan is allotted an included volume of marketing contacts, and pricing is based on a tiered discounting construct for additional marketing contacts (for instance, the first 1,001 to 3,000 contacts are $45 per month per 1,000 contacts, and 3,001 to 5,000 contacts are $40.50 per month per 1,000 contacts).
HubSpot’s pricing page allows us to configure pricing for the Enterprise plan to a maximum volume of 1,000,000 contacts and cost of approximately $124,000 USD per year. The call to action (CTA) for this plan is a “Talk to Sales” button, meaning that fulfillment of deals of this size is sales led. In fact, only HubSpot’s Starter plan is self-service, as the Professional plan also requires sales interaction.
What does this example tell us? It addresses a lot of aspects of the second question we shared above. The range of potential Marketing Hub ACV is very clear given HubSpot’s detailed and transparent pricing model. The sales CTAs by customer persona and deal size are also very clear on the pricing page. We could use this information to build a complete profile of HubSpot’s pricing and a detailed analysis of sales and contracting motions by customer type and deal size.
What the example doesn’t tell us, however, is anything that could help us answer the first question we shared above. Sure, it gives us a full range of potential ACV for HubSpot customers, but it tells us nothing about the breakdown of HubSpot’s customers by ACV. Since HubSpot is publicly traded, we can turn to its financial filings, where we find that HubSpot hovers around $10,000 ACV.
This insight, of course, helps us answer the first question above. We now understand not only the range of ACV price points at which HubSpot sells but also the average ACV of a HubSpot customer. Jason Lemkin of SaaStr provides a decent breakdown of HubSpot’s average ACV and what it means here.
We can then unlock further insight by combining the answers to these questions. The data above tells us that HubSpot scales well to support large enterprises with ACVs that can easily exceed $100,000 (the above data is just for Marketing Hub), but that its average ACV is $10,000. As HubSpot has scaled, average ACV has hovered around $10,000. This suggests that HubSpot’s growth has been fueled by retention and new customer acquisition more than aggressive upmarket expansion. HubSpot delivers solid net revenue retention through cross-sells and plan and usage upgrades, but these activities are not moving the firm demonstrably upmarket to enterprise-level average ACVs.
Extending from the example above, we’ll now look at each of our fundamental high-ACV questions from a broader industry benchmark level and provide some tips and frameworks for researching each question.
The best place to find data about ACV is the company’s financial filings, including S-1s as well as 10-Ks and 10-Qs. Here’s an example ACV analysis from Blossom Street Ventures, published in May 2022, which looked at average ACV for the 73 SaaS companies that had filed S-1s. The research found that SaaS companies at IPO had a median ACV of just under $50,000. If you’re looking for an overall industry baseline assessment of SaaS ACV, this is a good place to start.
To build this type of analysis more specifically for your competitors and/or your business case, as we said above, the best place to turn is published financial filings. Filings will typically provide direct data on ACV (or similar metrics) and/or provide the numerator and denominator information required to compute ACV. Be careful though; as we noticed previously, ACV is not a metric that the industry has standardized on. HubSpot, for example, reports on average subscription revenue per customer (ASRPC), not ACV. HubSpot’s ASRPC grew 11% year-to-year to $10,875 for 4Q21. Be sure to build analysis that is apples to apples when gathering metrics from Securities and Exchange Commission filings.
If you are short on publicly traded competitors, the next best source is secondary research, such as company websites, blogs, industry publications and database resources such as GetLatka. You likely won’t be able to get as precise as you would with public financial filings, but you can usually scrounge up data inputs to help triangulate a calculation. For example, this blog post on ClickUp outlines the firm’s annual recurring revenue (ARR), total number of paying customers and, consequently, its ACV (approximately $1,000).
You can extend this analysis as broadly or as deeply as your need requires. For example, maybe an overall average current year ACV for your top 10 closest competitors will suffice. Or perhaps you need to pick five competitors and analyze quarterly trends in ACV over the past three years, with analysis of overall ACV as well as breakdowns of ACV by each product plan that your customer sells and/or the different types of customers that they serve.
In each of these scenarios, the methodologies for ACV benchmark building are the same. Start with what’s public and based on financial and/or investor reporting. Once you’ve exhausted those resources, go to the next layer with secondary research. If you’ve also exhausted those avenues but still need to go deeper, you have a few choices.
If you have access to customers, you can interview former customers of your peers to understand buying patterns and behaviors and use those insights to inform the development of a model of estimated customer spending by competitor product plan. You can also use other industry resources to gather assumptions to inform the development of initial models that you will refine over time with more data.
For example, perhaps you can’t find enough Competitor A data to inform your ACV analysis. But you can find data on three or five companies that are similar in size to Competitor A, offer products to a common customer(s), package and price similarly, and go to market using similar motions. You can use those proxy competitors to build a hypothetical model of your competitor.
If you’re looking to build an analysis of high-ACV price points and GTM motions, the mechanics and tools are very similar to what we outlined in the previous section. Instead of financial filings, you’d start with peer pricing pages, and progress through secondary and primary research methods to build out your analysis. Otherwise, the techniques would be the same. You’re just pulling information on published prices instead of average customer ACVs.
To explore this topic for SaaS overall, we dove into our XaaS Pricing dataset. We analyzed approximately 6,300 price points across our SaaS pricing page index, which consists primarily of high-growth B2B SaaS and PLG companies. This included a broad and representative set of vendors of different sizes and maturity levels across a diverse set of SaaS categories.
Note also that this includes all published price points for the companies, products, and product editions that we track. We didn’t exclude or normalize pricing for different levels of volume, for example, as volume is a primary criterion that would drive higher ACV for certain customers. We also didn’t accommodate for volume with models where companies don’t publish volume pricing. For example, if Company A publishes prices for 1 to 10 users and 11 to 50 users, and Company B only provides a single per user price, this analysis does not normalize for those instances. We captured all prices as published for the purposes of this breakdown. We also excluded any product with usage-based pricing and no subscription term commitment, as there is no reliable way of applying an annualized price to those products for the purposes of this analysis.
To build this analysis, we looked at list prices for all products we cover. We normalized those prices from the pricing meter (such as per month) in which they are published into an annual price by making standard assumptions using traditional U.S. working hours. For example, if a price was published in hourly terms, we multiplied that price by 2,080 working hours (52 weeks in a year times 40 working hours per week) to compute an annual price. We used the same method for converting monthly prices into annual prices. We then grouped the full dataset based on the resulting annual price levels into groups in increments of $50,000 ACV.
Given the above calculations, we should stress that this is a top-level, rough analysis for the purposes of illustration and hypothesis development. To do this more granularly, we’d drill into the nuances of every single product in building out these comparisons.
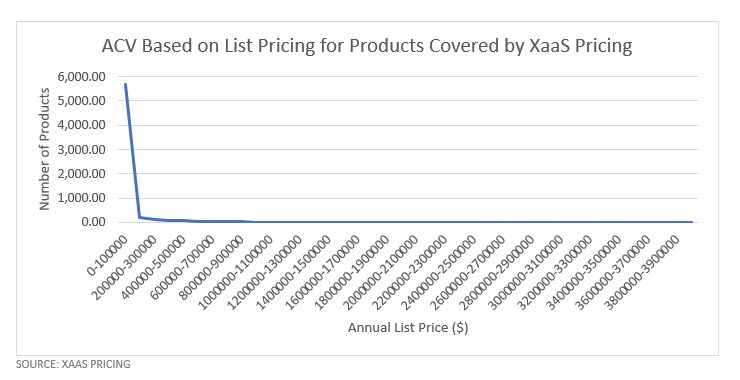
Here’s a summary chart representing the results of our analysis:

As the graph shows, approximately 90% of the products we included in this analysis have an implied ACV of between $0 and $100,000. Ninety-three percent of the products within that cohort have an implied ACV of less than $20,000.
This all makes sense. We’d expect most SaaS products to fall in that range and for there to be a long tail of other products that happen to publish high-ACV prices.
Looking at our index qualitatively, there are a few takeaways that we can draw about high-ACV pricing and GTM strategy for SaaS overall and specifically for PLG companies:
Overall, this data suggests a hypothesis. We believe that there is a low incidence of PLG companies that have high average annual contract values, whether you define that as greater than $50,000, greater than $100,000 or something else. We believe that there is a greater incidence of PLG companies that currently publish or will publish transparent pricing for contract values that scale up to and beyond these ACV thresholds. These companies will convert customers at higher ACVs via a traditional sales-led motion in the near term.
What does that mean practically? PLG will drive a movement toward more transparent volume pricing across SaaS, but it will take time for average ACVs to catch up to the availability of pricing to support larger clients. It will bear watching to assess how growth in ACV and evolving customer attitudes toward contract sizes for self-service purchasing impact transaction models for higher ACV SaaS deals. As this all evolves, we’ll be watching and tracking with our datasets.
Want to discuss SaaS ACV trends and/or need help setting up an ACV analysis for your business? Give us a shout! You can find me on Twitter at @bbelangerTBR or send your feedback directly to [email protected]. I read all replies. Be sure as always to subscribe to get our content sent to your inbox once it publishes. Thanks for following along!
 ©2022 XaaS Pricing. All rights reserved. Terms of Service | Website Maintained by Tidal Media Group
 XaaS Pricing
 Where should my company start with pricing?