Do I really need to compare pricing for different companies?
The short answer is yes. The longer answer is also yes, but with a bit of nuance — exactly what you’re comparing across companies, and the reasons you need to do those comparisons, may differ based on your role, firm and goals.
If you’re an established SaaS vendor, even if you’re committed to executing a purely value-based pricing strategy, your market category and competitors are going to come into play and warrant analysis for various reasons. That’s a topic we covered in detail in a different post.
If you’re a startup seeking to determine pricing for your product and to define your positioning in a competitive category, it is pivotal to understand the state of monetization in that category, as well as the best practices that various types of players within that category (e.g., best-in-class, high-growth) are using to win. If you are building a new category, it is important to understand how adjacent categories are monetizing SaaS so you can build a pricing strategy that aligns to customer value but is also familiar and comfortable for the buyer.
If you’re a SaaS buyer, this is a no-brainer. You want to get the best solution at the best possible pricing. To do this, you need to understand the entirety of the landscape in the category in which you’re looking to make a purchase, including how different solutions are priced. The same goes for venture capitalists (VCs) and other investors. If you have a stake in a key player within a category and/or are betting on a particular SaaS category, it is critical that you understand how that category is making money from the products that are sold.
SaaS pricing models — the same but also much, much different
We’ve talked quite a bit about the confusion that surrounds much of the web marketing content on SaaS pricing models. We’ve done our best to help buyers and sellers break down that confusion through previous posts such as this guide to SaaS pricing models.
In theoretical terms, we think SaaS pricing models are pretty simple, and many strategies are the same. You can price using a per-user, flat-fee, or usage-based model, or use a hybrid of all three. That’s really it. The same goes for things like packaging and metering. There are a set of high-level frameworks that are used across the SaaS industry and, more broadly, across “as a Service” generally.
Where things get (obviously) much more complex is in the tactical implementation of these models. For starters, it may not be intuitive which competitive plans should be compared, particularly if companies are unclear about which ideal customer profile each of its plans serves. Competitors in a category may use fundamentally different pricing models.
Company A may price per user, while Company B may use a flat-fee subscription model that allows “up to X users.” Many of the real challenges are introduced through how plans are “fenced” in tiered models. For example, Company A may limit usage for its entry-level self-service tier to 100 automations per month, while Company B may choose a different limit for the number of automations, use a different usage metric to define automations or, worse, not define its product in terms of automations at all.
That’s just a starter list. Any element of packaging, pricing models, price levels and discounting may vary from one vendor to another. When combined, these challenges create an exponential number of potential roadblocks to direct vendor-to-vendor pricing strategy comparisons.
Two tactics to use in comparing SaaS pricing for companies with different strategies
So, what’s a founder/company/customer/venture capitalist to do in this situation?
This is something we’ve been grappling with for over a decade as part of the competitive and market price benchmarking research and consulting work that we do. We’ve designed hundreds of studies to solve for these types of competitive normalization challenges.
In our experience there are two, often complementary, tactics that work best for building these types of comparisons:
- Scenario-based Normalization
- Unit-based Normalization
Before we break those down, it is worth noting that there is an important question you should ask yourself before you start building a comparison: “Why?” Get really clear on the goal of the pricing comparison you are trying to build and the motivations behind the goal. In some instances, comparing competitive pricing may be in response to a benchmarking requirement for a customer deal. Perhaps you are aiming to build a competitive pricing calculator for internal or external use to showcase your product’s pricing and TCO versus peers. Or maybe it’s a broader strategic effort being undertaken to evaluate and solidify your product’s positioning in the market.
If you can understand the key goal and desired outcomes you are driving toward, it will help immensely with determining the appropriate tactics to use when building the actual comparison. These tactics serve different types of competitive analysis outcomes.
Scenario-based Normalization
One of the biggest challenges with building any type of vendor-to-vendor pricing comparison, regardless of how aligned the pricing models are, is the universe of potential comparisons. Let’s take the example of a product that is priced with a per-user, per-month subscription model. A given deal could be 100 users, 1,027 users or 10,270 users. It could be a month-to-month deal or an annual agreement. It could include or not include add-ons. Maybe it’s a long-standing customer that is renewing for the fifth year of their agreement, or maybe it’s a new self-serve buyer. You could come up with an infinite number of specific scenarios like this requiring comparison.
If you need to solve for every conceivable customer scenario, you need to (a) start drinking extra coffee now, (b) rethink your goal or (c) jump ahead to unit-based normalization. If you’re like most, however, you probably need to design an approach around what we call scenario-based normalization.
Scenario-based normalization is built on an adaptation of the Pareto principle: 80% of the insights needed to inform our pricing comparison come from 20% of the possible scenarios.
What does this mean, practically? It’s true that there are unlimited ways you could potentially compare pricing versus a peer. But it is probably also true that you have some heuristics that define either the current status or the wanted status of a given product. Let’s take the example of the company that could sell its per-user, per-month product to 127 or 10,270 users. There are natural scenario frameworks based on how you have designed your plans. In our example, the 127-user scenario likely aligns to “Plan XYZ, which is best for businesses of 50 to 250 employees.” Within that plan, you likely have data on your customer makeup. Maybe 75% of customers are between 1 and 100 users and on a monthly plan, or whatever. There are likely some consumption statistics that define your typical and/or wanted customer for a given product and plan.
If you don’t have that data, stop here and go get a SaaS analytics product. If you don’t want to pay for that, ProfitWell is free and will give you everything you need to gather this data. There are many others in the space that provide fantastic products as well.
Using those analytics, create three to five representative deal scenarios that embody the 80% (or more) of your ideal customers for a given product and plan. It may be slightly more or less than three to five, but we have generally found that range to be successful for most companies that we work with. It also helps to build scenarios that define a typical small, medium and large deal for a given product and plan, such that you can understand how pricing scales with deal size for your product versus your competitors. Those scenarios would typically include elements such as:
- Size of the deal scenario (e.g., units, users — whatever metrics define scope)
- Term of the deal scenario
- Customer relationship scenario factors (e.g., new or renewal customer, size of customer, industry vertical, geography)
- Other product scenario considerations (e.g., add-ons, multiproduct purchase, support)
Once you’ve devised those scenarios, you have a single anchor point at which to compare your pricing versus your competitors. Regardless of how your competitor structures its packaging and pricing, you can build estimates of how the competitor will price to the deal scenarios you’ve created based on the makeup and structure of its strategy. You can then compare total solution cost for that competitor against your own and break down that total cost by the different factors to understand the competitive unit economics (e.g., comparing per user or per GB costs, or annualized costs).
The end goal with scenario-based normalization is not to benchmark and model every potential scenario. The analysis doesn’t spit out a single price point that is the right answer. The goal of this type of analysis is to index your pricing against your peers’ and understand how pricing scales for different types of shared customers. The insights gathered from this type of comparison are the first step in determining whether your pricing strategy aligns to your wanted positioning and customer value, and short-listing changes that may be required or additional research needed to explore those changes.
Scenario-based normalization may require using public and/or nonpublic information as well as internal and external data sources, depending on the scenarios you’re looking to compare and the depth and breadth of the analysis that you’re endeavoring to create. If you’re designing a full research project to get at these comparisons, you can find some tips on how to do so here. If you’re looking for some quick-win areas to find competitive insights to build these comparisons in a faster, agile manner, we shared some thoughts on sourcing for competitive pricing insights here.
Does all of this sound a little confusing or overwhelming? Not to worry; we’ll provide a tactical example with a case study later in this post.
Unit-based Normalization
Normalization strategies aren’t frequently either-or. Often, we’re normalizing at the scenario level, such that we can build an accurate and representative comparison of pricing at the unit level. Unit-based normalization involves creating comparisons of competitive pricing at the unit level that can be applied to any deal scenario or situation. This often makes unit-based normalization strategies helpful for building competitive pricing calculators or similar tools.
There are two ways to normalize a vendor’s pricing for units: (1) normalize to your product’s value metric or (2) normalize to your competitor’s value metric.
The latter is helpful for understanding the unit economics of a competitor’s strategy. For example, let’s assume Competitor A sells a monthly ice cream sundae subscription service (where can I sign up?). The service is offered with three tiers of monthly flat-fee subscription, where the tier entitles the customer to a defined benefit: “X pints of ice cream” and “Z toppings.” Let’s assume the Starter tier gives you two pints of ice cream and five toppings for $20 per month. To normalize to the unit level, you’d simply divide the $20 by the number of pints (2) and by the number of toppings (5), which reveals that the pricing is $10 per pint or $4 per topping. These unit-level pricing figures could then be used to evaluate how pricing would scale for different scenarios, and how volume factors may reduce the unit pricing.
For most use cases, the more valuable implementation of unit-based pricing is to normalize competitive pricing to your product’s primary value metric, such that you can compare pricing directly to your competitor. If you don’t have a singular value metric that defines how your product delivers value and scales with the customer, start there. Our post on the building blocks of SaaS pricing can help.
If competitors price using the same model as you or use a different model but have the same value metric, then unit-based normalization is easy. Let’s look at an example. For our recent XaaS Pricing Monthly Trends report, we built an analysis of pricing in the Storage as a Service space. Competitors in this market price with different models. Most charge a flat fee for a monthly subscription, where the flat fee is based on a committed amount of storage. Depending on the competitors, this commitment is measured in GiB, GB, TiB or TB. In this example, normalization is straightforward. If pricing is $1 per TB, this can be quickly adjusted to a per TiB, GB or GiB price, depending on what the anchor model is for comparison.
In other instances, this is not so straightforward. Let’s say that you offer a developer security and testing SaaS platform. Perhaps you charge using a usage-based model that is “per application test” or “per 1,000 application tests.” If your closest competitor charges per user or with a flat fee, you’ll need to normalize its pricing into a “per test” price. If the competitor defines its product tiers based on application tests, normalization is easy. If its Tier 1 product is priced at $20 per user, per month, or at a $200 per month flat fee, and allows for “50 application tests,” you can quickly do the math to normalize its pricing to a per-test model.
Where this gets difficult is if the competitor does not define its product usage based on “application tests.” In this scenario, you may be better off starting with a scenario-based normalization approach to get to a set of total deal costs that then can be normalized to your pricing. Another option would be to normalize your product’s pricing to your competitor’s value metric, or to do both. The option that makes the most sense likely again depends on your goals and needs.
Putting competitive pricing comparisons into practice
Sometimes it’s just easier to understand a concept with an example.
We’ve been talking about appointment scheduling software a lot recently, so let’s illustrate the concepts of scenario-based and unit-based pricing normalization with an example from the appointment scheduling space.
Let’s take two vendors for the purposes of illustration, Calendly and YouBook.Me. For this analysis, we’ll assume that we are Calendly, building a comparative analysis on YouBook.Me, an emerging competitor.
Our first step was to analyze the product packaging structure of each vendor. Calendly offers five plans, while YouBook.Me offers two plans, one paid and one free. Next, we itemized the features of YouBook.Me, given that it was the more limited offering in terms of packaging, and compared those features to Calendly’s plans. Based on this process, we determined that YouBook.Me’s paid plan most closely resembles Calendly’s Professional plan.
We then made some general assumptions about the ideal customer profile and customer segmentation mix for Calendly’s Professional plan to create five scenarios for the purposes of comparison. We aren’t Calendly, so we don’t have this data, but if we were, we’d replace these assumptions using the 80-20 rule we discussed earlier in this post. Next, we began building the comparison by analyzing the pricing and packaging models for each vendor. In this example, the key difference is that Calendly prices its Professional plan per user, per month, and allows each user up to six connected calendars. YouBook.Me prices per calendar, not per user. To navigate this comparison, we had to make some different assumptions about the typical number of calendar connections Calendly users have. While six is the maximum, if customers are using fewer calendars, this impacts the comparison. We also didn’t make any assumptions about differences in pricing for volume-based or other discounting, although we’d encourage those building this type of analysis to do so based on their internal volume pricing and discounting levels.
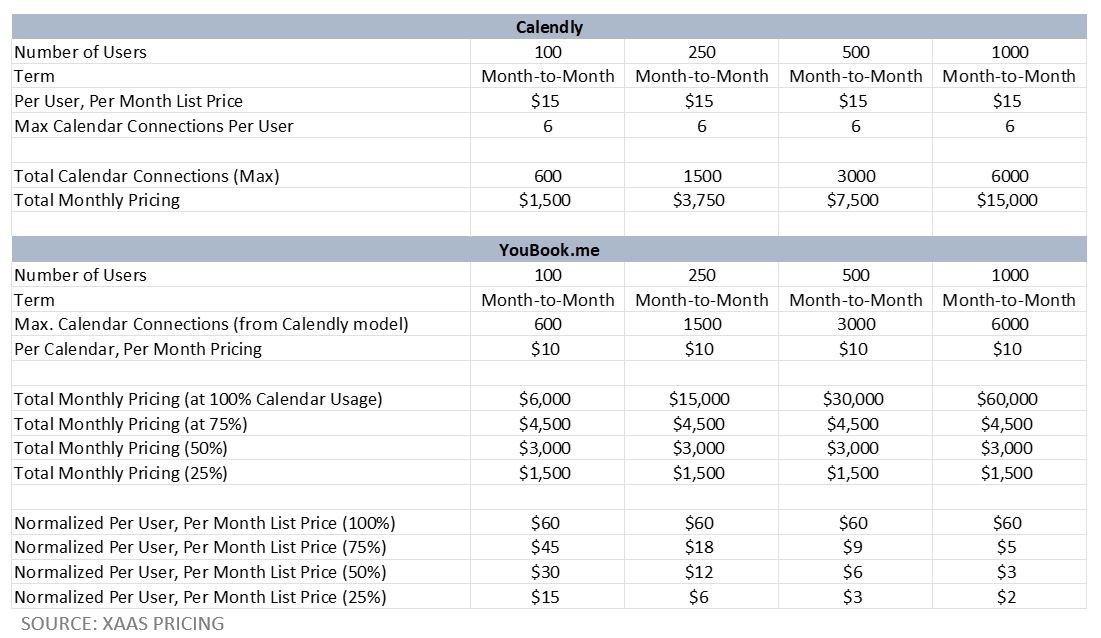
After making these assumptions, we were able to build four basic scenarios defined by number of users, subscription term, and number of calendars per user. Once this scenario frame was set, we simply calculated total solution pricing for Calendly, and then used our assumptions based on Calendly’s calendar connections model to apply to the same calculations for YouBook.Me.
The results of this analysis are outlined in the chart below.
The comparison reveals a really interesting takeaway. On the surface, YouBook.Me looks competitively priced relative to Calendly. YouBook.Me is priced at $10 per calendar, per month, while for the equivalent offering Calendly is priced at $15 per user, per month. However, the key metric that sits at the intersection of these two firms is the number of calendars per user. YouBook.Me pricing scales quickly beyond Calendly with additional connected calendars. The inflection point is 1.5 connected calendars; at 1.5 calendars per user, pricing is the same. If the average YouBook.Me user requires more than 1.5 connected calendars, that product becomes more expensive than Calendly.
If we were Calendly, this is where we’d dig in a little deeper on this analysis. Calendly allots a maximum number of connected calendars to users, but this doesn’t mean all users reach the maximum allotment. Calendly likely has data on the average connected calendars used. It would be valuable to dig out that metric and apply it to the analysis outlined in the chart below. If the actual number of calendar connections used is closer to 1.5 than 6, then the customer value captured from that feature for the price is more equivalent to YouBook.Me. This data may signal differences in positioning to different types of users. It may also signal an opportunity to reduce the fence sizing on calendar connections and offer a more competitive price, or move some features from the Professional plan into the Essentials plan so that lower-tier plan competes with YouBook.me.


 ©2022 XaaS Pricing. All rights reserved.
